BOS311 Civic Dashboard
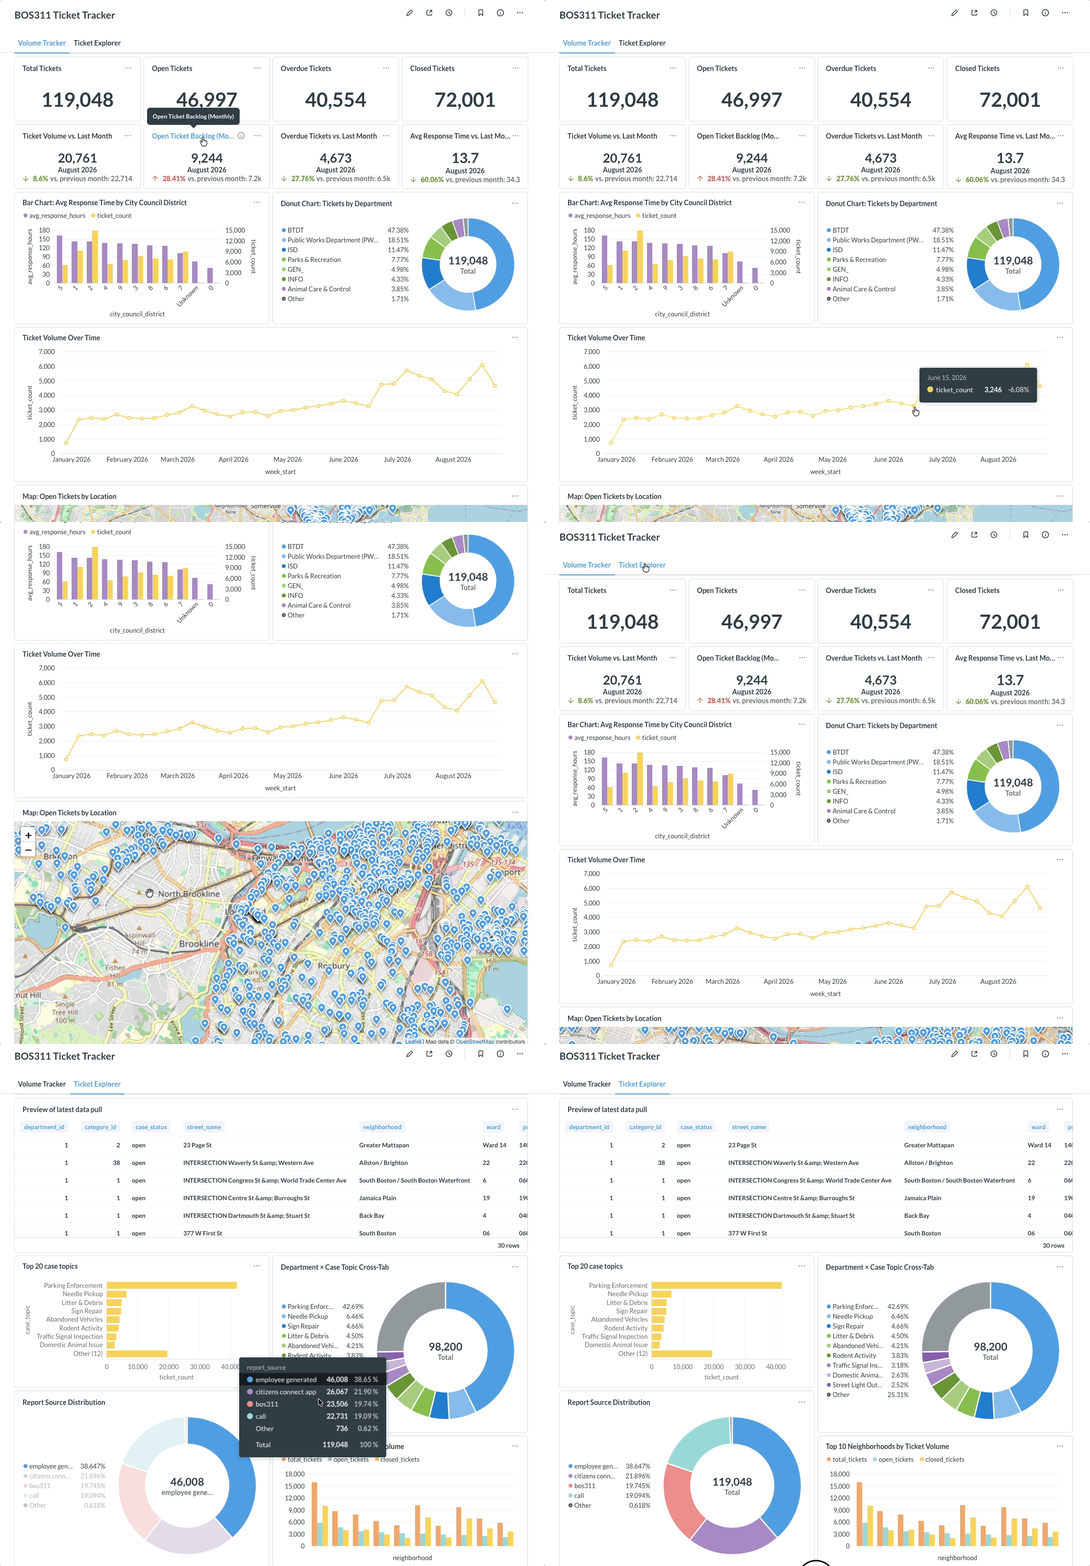
Explore Boston’s 311 service request data through the interactive dashboard. Use the filters to narrow by date range, department, neighborhood, or case status. Click any chart element to cross-filter the rest of the view.
I originally wanted to embed a live Metabase dashboard here, but Metabase Cloud charges $100 per month just to host it. So instead, I made this GIF to show the key features and interactivity.